If you live in any of these 20 cities, you spend the most time stuck In traffic…

This article covers:
Sitting behind the wheel and looking at a bevvy of vehicles inching their way forward on the highway – if this scenario sounds a bit too familiar, you are one of the millions of people who drive to and from work each day (Kudos to you!).
In an era where companies are vying to grab the consumer’s attention with the sleekest of gadgets, the fastest of cars and the promise of saving time, it’s ironic that people end up spending a big chunk of their day stuck behind the wheels daily.
How does traffic congestion affect society?
Ah, traffic congestion, is the bane of every commuter’s existence. It’s like standing in line for the roller coaster at Disneyland, except you don’t get a thrill at the end. All you get is frustration, increased travel costs, and an overwhelming desire to scream at the top of your lungs.
But it’s not just your sanity that suffers. No, no. Your city’s economic growth takes a hit and noise pollution levels go through the roof. And let’s not forget about the ever-present driver stress and decreased mental satisfaction.
Now, let’s look at the world’s worst cities where an average commuter spends anywhere between 1 hour and 1.5 hours stuck in traffic.
20 worst cities to commute in the world
Rank | City | Time Index |
1 | Lagos, Nigeria | 67.4 |
2 | Dhaka, Bangladesh | 61.6 |
3 | Colombo, Sri Lanka | 59.5 |
4 | Kolkata, India | 59.4 |
5 | Los Angeles, CA, United States | 58 |
6 | Delhi, India | 57.7 |
7 | Mumbai, India | 55.3 |
8 | Manila, Philippines | 54.5 |
9 | Bangalore, India | 54.1 |
10 | Nairobi, Kenya | 53.4 |
11 | Mexico City, Mexico | 52.9 |
12 | San Francisco, CA, United States | 52.7 |
13 | Tehran, Iran | 52.5 |
14 | Jakarta, Indonesia | 52.4 |
15 | Bogota, Colombia | 51.9 |
16 | Washington, DC, United States | 51.8 |
17 | Istanbul, Turkey | 51.3 |
18 | Rio de Janeiro, Brazil | 51.2 |
19 | Sao Paulo, Brazil | 50.4 |
20 | Lima, Peru | 50.3 |
Let’s look at how cities fare continents wise…
Africa
Rank | City | Time Index (In minutes) |
1 | Lagos, Nigeria | 67.4 |
2 | Nairobi, Kenya | 53.4 |
3 | Cairo, Egypt | 50 |
4 | Pretoria, South Africa | 45.1 |
5 | Cape Town, South Africa | 42.4 |
6 | Johannesburg, South Africa | 40.8 |
7 | Durban, South Africa | 25.5 |
North America
Rank | City | Time Index (In minutes) |
1 | Los Angeles, CA, United States | 58 |
2 | San Francisco, CA, United States | 52.7 |
3 | Washington, DC, United States | 51.8 |
4 | Seattle, WA, United States | 47 |
5 | San Jose, CA, United States | 46.3 |
6 | Boston, MA, United States | 46.3 |
7 | Atlanta, GA, United States | 44.4 |
8 | Houston, TX, United States | 44.3 |
9 | Toronto, Canada | 44.3 |
10 | Honolulu, HI, United States | 44 |
11 | New York, NY, United States | 43.6 |
12 | Chicago, IL, United States | 42.6 |
13 | Miami, FL, United States | 42.1 |
14 | San Diego, CA, United States | 40.7 |
15 | Philadelphia, PA, United States | 40.4 |
16 | Albuquerque, NM, United States | 40.2 |
17 | Dallas, TX, United States | 40 |
18 | Montreal, Canada | 39.6 |
South America
Rank | City | Time Index (In minutes) |
1 | Sao Paulo, Brazil | 50.4 |
2 | Rio de Janeiro, Brazil | 51.2 |
3 | Lima, Peru | 50.3 |
4 | Bogota, Colombia | 51.9 |
5 | Buenos Aires, Argentina | 49.7 |
6 | Recife, Brazil | 46.5 |
7 | Belo Horizonte, Brazil | 43.6 |
8 | Medellin, Colombia | 39 |
9 | Montevideo, Uruguay | 38.8 |
10 | Santiago, Chile | 37.9 |
11 | Curitiba, Brazil | 32.6 |
12 | Brasilia, Brazil | 30.6 |
13 | Porto Alegre, Brazil | 31.3 |
Asia
Rank | City | Time Index (In minutes) |
1 | Dhaka, Bangladesh | 61.6 |
2 | Colombo, Sri Lanka | 59.5 |
3 | Kolkata, India | 59.4 |
4 | Delhi, India | 57.7 |
5 | Mumbai, India | 55.3 |
6 | Manila, Philippines | 54.5 |
7 | Bangalore, India | 54.1 |
8 | Tehran, Iran | 52.5 |
9 | Jakarta, Indonesia | 52.4 |
10 | Istanbul, Turkey | 51.3 |
11 | Shanghai, China | 47.8 |
12 | Chennai, India | 46.8 |
13 | Bangkok, Thailand | 45.6 |
14 | Pune, India | 45.5 |
15 | Beijing, China | 43.3 |
16 | Karachi, Pakistan | 42.7 |
17 | Hyderabad, India | 42.6 |
18 | Hong Kong, Hong Kong (China) | 42.4 |
19 | Seoul, South Korea | 42.2 |
20 | Kuala Lumpur, Malaysia | 41.8 |
Europe
Rank | City | Time Index (In minutes) |
1 | Moscow, Russia | 50 |
2 | Saint Petersburg, Russia | 48.5 |
3 | London, United Kingdom | 45.3 |
4 | Kiev (Kyiv), Ukraine | 43 |
5 | Novosibirsk, Russia | 41.3 |
6 | Zurich, Switzerland | 41.1 |
7 | Paris, France | 41.1 |
8 | Bucharest, Romania | 40.8 |
9 | Dublin, Ireland | 40.7 |
10 | Manchester, United Kingdom | 39 |
11 | Budapest, Hungary | 39 |
12 | Rome, Italy | 38.4 |
13 | Athens, Greece | 38.2 |
14 | Kharkiv, Ukraine | 38.2 |
15 | Yekaterinburg, Russia | 37.5 |
16 | Brussels, Belgium | 36.9 |
17 | Odessa (Odesa), Ukraine | 36.6 |
18 | Milan, Italy | 36.3 |
19 | Belgrade, Serbia | 36 |
20 | Wroclaw, Poland | 35.6 |
Source: https://www.numbeo.com/traffic/rankings.jsp
You Might Also Want To Read: Visiting Ireland? Over 80 Slangs & Phrases You Might Want to Know
Before you go…
Let’s face it, being stuck in traffic is one of those situations that makes you want to scream, cry and pull your hair out all at once. It’s the perfect storm of frustration, anxiety and boredom. But instead of dwelling on your misery, why not take advantage of the situation?
Instarem is the perfect solution for you to send money overseas without having to physically be there.
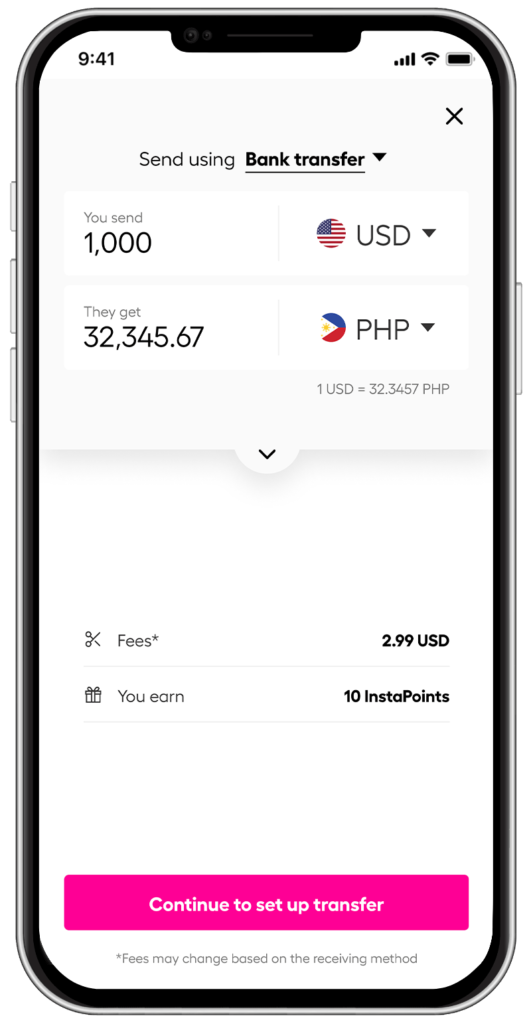
*Rates are for illustration purposes only.
You can complete the entire process from the comfort of your car – well, as long as you’re not driving of course! So while you’re stuck in traffic, don’t let the stress get to you. Just download the app and send some money back home. It’s the perfect distraction from all those honking horns.
Try Instarem for your next transfer by downloading the app or sign up here.
*Disclaimer: This article is intended for informational purposes only. All details are accurate at the time of publishing. Instarem has no affiliation or relationship with products or vendors mentioned.